Sanborn County, South Dakota
Sanborn County | |
|---|---|
 Steam-powered automobile by E.S. Callihan in Woonsocket (1884) | |
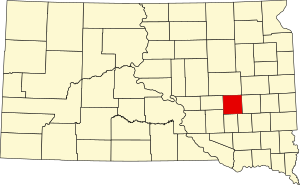
 Location within the U.S. state of South Dakota | |
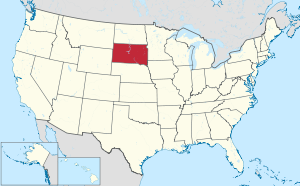
 South Dakota's location within the U.S. | |
| Coordinates: 44°02′N 98°05′W / 44.03°N 98.09°W | |
| Country | |
| State | |
| Founded | 1883 |
| Named for | George W. Sanborn |
| Seat | Woonsocket |
| Largest city | Woonsocket |
| Area | |
• Total | 570 sq mi (1,500 km2) |
| • Land | 569 sq mi (1,470 km2) |
| • Water | 1.2 sq mi (3 km2) 0.2% |
| Population (2020) | |
• Total | 2,330 |
• Estimate (2023) | 2,399 |
| • Density | 4.1/sq mi (1.6/km2) |
| Time zone | UTC−6 (Central) |
| • Summer (DST) | UTC−5 (CDT) |
| Congressional district | At-large |
Sanborn County is a county in the U.S. state of South Dakota. As of the 2020 census, the population was 2,330.[1] Its county seat and largest city is Woonsocket.[2] The county was created by the Dakota Territorial legislature on May 1, 1883, with land partitioned from Miner County. It was fully organized by July 18, 1883.[3]
Geography
[edit]The terrain of Sanborn County consists of rolling hills, largely devoted to agriculture. The James River flows southward through the east-central part of the county, and the SW part of the country is drained by Dry Run Creek.[4] The terrain slopes to the south and to the southeast; its highest point is in its SW corner, at 1,358 ft (414 m) ASL.[5] The county has a total area of 570 square miles (1,500 km2), of which 569 square miles (1,470 km2) is land and 1.2 square miles (3.1 km2) (0.2%) is water.[6]
Major highways
[edit]Adjacent counties
[edit]- Beadle County - north
- Kingsbury County - northeast
- Miner County - east
- Hanson County - southeast
- Davison County - south
- Aurora County - southwest
- Jerauld County - west
- McCoy Lake State Public Shooting Area
- Long Lake
- Twin Lakes (partial)
Demographics
[edit]| Census | Pop. | Note | %± |
|---|---|---|---|
| 1890 | 4,610 | — | |
| 1900 | 4,464 | −3.2% | |
| 1910 | 6,607 | 48.0% | |
| 1920 | 7,877 | 19.2% | |
| 1930 | 7,326 | −7.0% | |
| 1940 | 5,754 | −21.5% | |
| 1950 | 5,142 | −10.6% | |
| 1960 | 4,641 | −9.7% | |
| 1970 | 3,697 | −20.3% | |
| 1980 | 3,213 | −13.1% | |
| 1990 | 2,833 | −11.8% | |
| 2000 | 2,675 | −5.6% | |
| 2010 | 2,355 | −12.0% | |
| 2020 | 2,330 | −1.1% | |
| 2023 (est.) | 2,399 | [7] | 3.0% |
| U.S. Decennial Census[8] 1790-1960[9] 1900-1990[10] 1990-2000[11] 2010-2020[1] | |||
2020 census
[edit]As of the 2020 census, there were 2,330 people, 936 households, and 630 families residing in the county.[12] The population density was 4.1 inhabitants per square mile (1.6/km2). There were 1,134 housing units.
2010 census
[edit]As of the 2010 census, there were 2,355 people, 975 households, and 630 families in the county. The population density was 4.1 inhabitants per square mile (1.6/km2). There were 1,172 housing units at an average density of 2.1 units per square mile (0.81 units/km2). The racial makeup of the county was 98.0% white, 0.3% American Indian, 0.2% Asian, 0.6% from other races, and 1.1% from two or more races. Those of Hispanic or Latino origin made up 1.2% of the population. In terms of ancestry.
Of the 975 households, 24.2% had children under the age of 18 living with them, 55.0% were married couples living together, 6.3% had a female householder with no husband present, 35.4% were non-families, and 31.1% of all households were made up of individuals. The average household size was 2.24 and the average family size was 2.79. The median age was 47.1 years.
The median income for a household in the county was $44,732 and the median income for a family was $56,304. Males had a median income of $32,361 versus $23,724 for females. The per capita income for the county was $21,055. About 7.7% of families and 12.7% of the population were below the poverty line, including 21.4% of those under age 18 and 15.1% of those age 65 or over.
Communities
[edit]City
[edit]- Woonsocket (county seat)
Towns
[edit]Census-designated place
[edit]Unincorporated community
[edit]Townships
[edit]- Afton
- Benedict
- Butler
- Diana
- Elliott
- Floyd
- Jackson
- Letcher
- Logan
- Oneida
- Ravenna
- Silver Creek
- Twin Lake
- Union
- Warren
- Woonsocket
Politics
[edit]Sanborn County has been a swing county in the past, but in recent decades has tended to vote Republican. In 64% of the national elections since 1960, the county selected the Republican Party candidate (as of 2020).
| Year | Republican | Democratic | Third party(ies) | |||
|---|---|---|---|---|---|---|
| No. | % | No. | % | No. | % | |
| 2020 | 905 | 76.37% | 257 | 21.69% | 23 | 1.94% |
| 2016 | 819 | 72.93% | 241 | 21.46% | 63 | 5.61% |
| 2012 | 688 | 61.70% | 389 | 34.89% | 38 | 3.41% |
| 2008 | 669 | 55.43% | 500 | 41.43% | 38 | 3.15% |
| 2004 | 817 | 57.29% | 581 | 40.74% | 28 | 1.96% |
| 2000 | 767 | 60.49% | 468 | 36.91% | 33 | 2.60% |
| 1996 | 630 | 43.81% | 647 | 44.99% | 161 | 11.20% |
| 1992 | 595 | 36.96% | 632 | 39.25% | 383 | 23.79% |
| 1988 | 815 | 51.10% | 770 | 48.28% | 10 | 0.63% |
| 1984 | 1,080 | 63.72% | 611 | 36.05% | 4 | 0.24% |
| 1980 | 1,178 | 60.97% | 628 | 32.51% | 126 | 6.52% |
| 1976 | 881 | 46.08% | 1,025 | 53.61% | 6 | 0.31% |
| 1972 | 1,064 | 49.60% | 1,074 | 50.07% | 7 | 0.33% |
| 1968 | 1,024 | 49.71% | 956 | 46.41% | 80 | 3.88% |
| 1964 | 912 | 39.43% | 1,401 | 60.57% | 0 | 0.00% |
| 1960 | 1,254 | 50.10% | 1,249 | 49.90% | 0 | 0.00% |
| 1956 | 1,327 | 50.48% | 1,302 | 49.52% | 0 | 0.00% |
| 1952 | 1,761 | 66.05% | 905 | 33.95% | 0 | 0.00% |
| 1948 | 990 | 48.03% | 1,046 | 50.75% | 25 | 1.21% |
| 1944 | 1,212 | 54.84% | 998 | 45.16% | 0 | 0.00% |
| 1940 | 1,732 | 55.34% | 1,398 | 44.66% | 0 | 0.00% |
| 1936 | 1,174 | 36.64% | 1,919 | 59.89% | 111 | 3.46% |
| 1932 | 860 | 26.21% | 2,398 | 73.09% | 23 | 0.70% |
| 1928 | 1,576 | 54.08% | 1,321 | 45.33% | 17 | 0.58% |
| 1924 | 1,184 | 47.34% | 327 | 13.07% | 990 | 39.58% |
| 1920 | 1,125 | 49.89% | 517 | 22.93% | 613 | 27.18% |
| 1916 | 711 | 42.00% | 898 | 53.04% | 84 | 4.96% |
| 1912 | 0 | 0.00% | 577 | 37.13% | 977 | 62.87% |
| 1908 | 847 | 57.70% | 513 | 34.95% | 108 | 7.36% |
| 1904 | 1,013 | 74.05% | 265 | 19.37% | 90 | 6.58% |
| 1900 | 628 | 51.56% | 549 | 45.07% | 41 | 3.37% |
| 1896 | 530 | 50.72% | 500 | 47.85% | 15 | 1.44% |
| 1892 | 564 | 55.62% | 95 | 9.37% | 355 | 35.01% |
Education
[edit]School districts include:[14]
- Huron School District 02-2
- Mount Vernon School District 17-3
- Sanborn Central School District 55-5
- Wessington Springs School District 36-2
- Woonsocket School District 55-4
See also
[edit]References
[edit]- ^ a b "State & County QuickFacts". United States Census Bureau. Retrieved March 20, 2024.
- ^ "Find a County". National Association of Counties. Retrieved June 7, 2011.
- ^ History of SD Counties/Sanborn (accessed February 8, 2019)
- ^ a b c Sanborn County SD Google Maps (accessed February 8, 2019)
- ^ ""Find an Altitude" Google Maps (accessed February 8, 2019)". Archived from the original on May 21, 2019. Retrieved February 8, 2019.
- ^ "2010 Census Gazetteer Files". United States Census Bureau. August 22, 2012. Retrieved March 28, 2015.
- ^ "County Population Totals and Components of Change: 2020-2023". Retrieved March 17, 2024.
- ^ "U.S. Decennial Census". United States Census Bureau. Retrieved March 28, 2015.
- ^ "Historical Census Browser". University of Virginia Library. Retrieved March 28, 2015.
- ^ Forstall, Richard L., ed. (March 27, 1995). "Population of Counties by Decennial Census: 1900 to 1990". United States Census Bureau. Retrieved March 28, 2015.
- ^ "Census 2000 PHC-T-4. Ranking Tables for Counties: 1990 and 2000" (PDF). United States Census Bureau. April 2, 2001. Archived (PDF) from the original on October 9, 2022. Retrieved March 28, 2015.
- ^ "US Census Bureau, Table P16: Household Type". United States Census Bureau. Retrieved March 20, 2024.
- ^ Leip, David. "Atlas of US Presidential Elections". uselectionatlas.org. Retrieved April 15, 2018.
- ^ "2020 CENSUS - SCHOOL DISTRICT REFERENCE MAP: Sanborn County, SD" (PDF). U.S. Census Bureau. Retrieved April 10, 2024. - Text list

